Evaluating Diversity of Microbes Different Soil Samples
| ✅ Paper Type: Free Essay | ✅ Subject: Environmental Sciences |
| ✅ Wordcount: 1413 words | ✅ Published: 23 Sep 2019 |
This experiment was performed to establish the differences in number and type of microbes in two samples of soils.
Abstract
To investigate the effects of different soil type and soil management styles, the levels of living organisms in the soil were determined by collecting soil from two different regions. The results would confirm whether there was a major variability in components of the two samples of the soils. Therefore, the objective of the study was to evaluate the fungal, simple bacterial, and actinobacterial community structures and diversity in the soils.
Introduction
Determination of the components of the soil is crucial as it provides insights on the use of the soil, the preservation mechanisms, and the quality of the soil. As such, the organic and inorganic matters in the soil are critical in determining the quality of soil. According to Costa et al. (2018), estimation of dissolved carbon dioxide concentration in the soil profile can indicate the organic matter in the soil and the changes in the vegetation cover. The CO2 efflux emanate from respiration of roots and the root-associated microorganisms and microbial respiration. Therefore, when estimating the quality of the soil, it would be critical to examine the CO2 efflux partitioning (Rodeghiero et al. 2013). The soil type and the quality of organic material would then influence the microbial biomass. Therefore, different soil types and the type of soil cover would influence the functional diversity of soils (Li et al., 2018). For instance, clay soils and organic C components of the soil could affect the microbial functional diversity of soil. Besides, soil mineralization and fertilization process can influence the amount of microbes in soil (Guo et al. 2019). Therefore, long-term fertilization can greatly determine the number of microbes in a particular soil type. In determining the biomass of soil, Sommermann et al. (2018) notes that fungal communities are very sensitive and are affected by the vegetation management and the soil type. Therefore, tillage and fertilization practices can affect the fungal communities in the long term.
Objective of the study
The objective of the study was to evaluate the fungal, simple bacterial, and actinobacterial community structures and diversity in the soils by observing and calculating the colony forming units per millilitre.
Hypothesis
The study hypothesised that the composition and the structure of the fungal, simple bacterial, and actinobacterial communities varied according to the soil type, vegetation coverage, and soil use.
Materials and methods
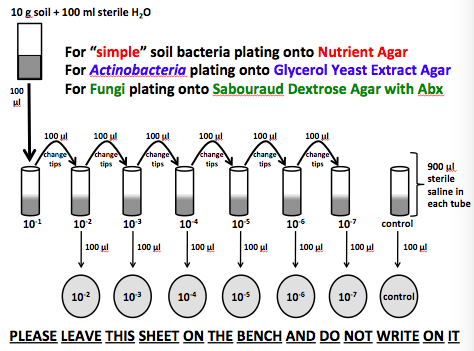
Before beginning the experiment, the workstations where cleaned and properly set up with the soil sample, sterile saline, sterile micropipettes, sterile tips, sterile micro tubes, and seven sterile GYEA (glycerol yeast extract agar), sabouraud dextrose agar, or nutrient agar plates. This experiment was divided among 6 groups containing 4 members. All plates were labelled prior to beginning the procedure, properly separating the control from the experimental plates. Eight micro tubes were then properly labelled, with 0.9 mL of sterile saline added to each tube aseptically. After, 10 grams of soil was mixed with 100 mL of sterile water, 1 mL of the mixed solution was transferred to tube 1 of sterile saline. The next step requires members to aseptically transfer 1 mL from tube 1 to tube 2, and discard the tip. This step is repeated from tube 2 to 3, 3 to 4, 4 to 5, 5 to 6, and 6 to 7, tube 8 remains untouched and is the control. Then, aseptically transfer 1 mL of mixed solution from tube 2 into a sterile Petri dish filled with the properly assigned agar, and discard the tip properly. Repeat this step for tubes 3-8. Be sure to dip the metal spreader in ethanol, flamed, and cooled before using to spread the contents all over the agar, each time to keep from contaminating each sample.
Image 1. This is an image depicting the steps taken in performing the experiment. Image obtained from (Canvas.ou.edu, 2019)
Results
Table 1: A table was created to document the outcomes of the soil samples incubated on three different agar samples, by 6 different groups.
|
Soil 1 |
|
CONTROL |
10^-1 |
10^-2 |
10^-3 |
10^-4 |
10^-5 |
10^-6 |
10^-7 |
|
|
|
NA |
|
||||||||
|
Raw Colony Count |
0 |
TMTC |
TMTC |
TMTC |
69 |
TFTC |
TFTC |
0 |
||
|
CFUs |
6.9×10^6 |
|||||||||
|
Colony Morphs |
red, circular, entire, raised |
Yellow, circular, entrie, raised |
Green, circular, entire, raised |
|||||||
|
GYEA |
|
|||||||||
|
Raw Colony Count |
0 |
TMTC |
TMTC |
TMTC |
TMTC |
153 |
101 |
34 |
||
|
CFUs |
0 |
1.53 x 10^8 |
1.01 x 10^9 |
3.4×10^9 |
||||||
|
Colony Morphs |
Small yellow, purple, pale white circular, flat, some mucousy |
Yellow and pale white circular, medium circular, flat |
||||||||
|
Sab+ab |
|
|||||||||
|
Raw Colony Count |
0 |
TMTC |
TMTC |
TMTC |
56 |
TFTC |
TFTC |
0 |
||
|
CFUs |
0 |
5.6x 10^6 |
||||||||
|
Colony Morphs |
N/A |
Microbe 1. large, fuzzy, veiny Microbe 2. circular, beige, concave, gooey. Microbe 3. small, circular, yellow, and convex |
||||||||
|
Soil 2 (Red Soil) |
|
CONTROL |
10^-1 |
10^-2 |
10^-3 |
10^-4 |
10^-5 |
10^-6 |
10^-7 |
|
|
|
NA |
|
||||||||
|
Raw Colony Count |
0 |
234 |
74 |
12 |
1 |
0 |
34 |
0 |
||
|
CFUs |
2.34*10^4 |
7.40*10^4 |
3.40*10^8 (This could be potential contamination) |
|||||||
|
Colony Morphs |
1. large, light yellow/beige, round, shiny, entire 2. dark yellow/beige, round, shiny, entire 3. small, yellow, round, entire |
1. yellow, irregular, shiny, matte 2. light yellow, irregular/ ripples from center, shiny 3. circular, entire, beige, clear around edges |
small, light beige/white, round, entire |
|||||||
|
GYEA |
|
|||||||||
|
Raw Colony Count |
307 |
66 |
TFTC |
TFTC |
TFTC |
TFTC |
TFTC |
|||
|
CFUs |
||||||||||
|
Colony Morphs |
Milky-tan, mucus-like, convex, circular, complete margin, entire |
Umbinate, white outside/clear middle, shiny, circular (double), complete margin, entire |
White, entire, convexm dewy 2ndary metabolite, complete margin, circular |
|||||||
|
Sab+ab |
|
|||||||||
|
Raw Colony Count |
0 |
4 |
0 |
0 |
0 |
0 |
0 |
1 |
||
|
CFUs |
4 |
1 |
||||||||
|
Colony Morphs |
1. big fuzzy white “colony, probably mold. 2. medium tan colony 3. smaller tan colony |
1. single fuzzy colony probably mold. It is white on one side tan on the other. |
Table 1 represents the colony counts for the actinobacteria, simple bacteria, and fungi in two different samples of soil. The colony morphology and forming units were also noted in the experiment. The numbers of the colonies of the microbes were counted in the various concentrations that were made through the dilution method.
Discussion/conclusion
The dilution method was used to determine the numbers of microbes in the two soil samples. The study would indicate the variation in the numbers of fungi and bacteria in the two soils. From the results, soil sample 1 had more microbes compared to sample 2. As such, the microbes (simple bacteria, actinobacteria, and fungi) were in counts of TMTC (too many to count) in sample 1. Furthermore, sample 1 soil consisted of various organisms as determined by the colors and shapes of the colony morphology. In soil sample 1, the likely organisms include; Serritia sp. (red), Micrococcus sp. (yellow) and Pseudomonas sp. (green). The actinobacteria represent the gram-positive bacteria that could be living symbiotically with plants. On the other hand, sample 2 (red soil) had simple bacteria included Pseudomonas sp. and Staphylococcus sp. As such, soil sample 2 lacked the Serritia sp.
Notably, soil sample 1 had high quantities of actinobacteria that implied that the soil was good for agricultural activity. On the other hand, soil sample 2 had few colonies for actinobacteria. Furthermore, soil sample 1 had greater number of colonies of the fungi. As for the fungi in soil type 2, the most prevalent fungi was mold. However, the colony forming units of the mold were few.
In conclusion, soil sample 1 had a larger proportion of the living microbes compared to sample 2. Therefore, it would be important to indicate that soil type 1 was useful for purposes of agriculture. However, it would be important to note that the backyard did not contain many plants in sample 1. The results confirmed that the location of the soil determines the type of microbes. For instance, the mold in soil sample 2 confirms the moist nature of the source of the soil.
References
- Costa, E. N. D. da, Landim de Souza, M. F., Lima Marrocos, P. C., Lobao, D., & Lopes da Silva, D. M. (2018). Soil organic matter and CO.sub.2 fluxes in small tropical watersheds under forest and cacao agroforestry. PLoS ONE, (7). https://doi.org/10.1371/journal.pone.0200550
- Canvas.ou.edu. (2019). OU Sign In. [online] Available at https://canvas.ou.edu/courses/109156 [Accessed 15 Feb. 2019].
- Guo, Z., Han, J., Li, J., Xu, Y., & Wang, X. (2019). Effects of long-term fertilization on soil organic carbon mineralization and microbial community structure. PLoS ONE, (1).
- Li, L., Xu, M., Eyakub Ali, M., Zhang, W., Duan, Y., & Li, D. (2018). Factors affecting soil microbial biomass and functional diversity with the application of organic amendments in three contrasting cropland soils during a field experiment. PLoS ONE, 13(9), 1–18. https://doi.org/10.1371/journal.pone.0203812
- Rodeghiero, M., Churkina, G., Martinez, C., Scholten, T., Gianelle, D., & Cescatti, A., (2013). Components of forest soil CO₂ efflux estimated from △^1^^4^C values of soil organic matter. Plant and Soil, 364(1/2), 55. https://doi.org/10.1007/s11104-012-1309-1
- Sommermann, L., Geistlinger, J., Wibberg, D., Deubel, A., Zwanzig, J., Babin, D., … Schellenberg, I. (2018). Fungal community profiles in agricultural soils of a long-term field trial under different tillage, fertilization and crop rotation conditions analyzed by high-throughput ITS-amplicon sequencing. PLoS ONE, 13(4), 1–32. https://doi.org/10.1371/journal.pone.0195345
Cite This Work
To export a reference to this article please select a referencing stye below:
Related Services
View all


DMCA / Removal Request
If you are the original writer of this essay and no longer wish to have your work published on UKEssays.com then please click the following link to email our support team:
Request essay removal