Design of Wind Turbine Control
| ✅ Paper Type: Free Essay | ✅ Subject: Engineering |
| ✅ Wordcount: 4398 words | ✅ Published: 31 Aug 2017 |
ABSTRACT
The main objective of this report is the design and analysis of the control of the wind turbine. In order to ensure an efficient energy capture from the wind and at the same time the mitigation of loads at natural frequencies, it will be designed the operating strategy of the machine. Furthermore, the control of the wind turbine will be also designed in order to ensure a stable performance of the system given the stochastic nature of the wind. As a last task, it will be analysed the differences and importance of having a system with a good or reduced crossover frequency.
Introduction
The exploitation of wind energy is undoubtedly the most popular tool for the tackling of climate change all over the world. The development of wind turbines has led to a variable speed pitch regulated configuration that aims to extract energy from the wind as efficiently as possible. As the penetration of wind energy becomes more and more significant in modern power systems, there is a need to meet certain criteria and quality of generation in order to maintain the reliability and security of supply above certain levels.
In order to achieve an optimize energy capture and prevent the machine from excessive loads, the design of both operating strategy and controller of the plant need to be carried out. The difficulty of the design relies on the stochastic nature of the wind, so a carefully and detailed approach is needed. Also, as the controller of the turbine is the heart of its operation, the design of this will become more and more difficult with the size of the turbine [1]. The larger the turbine, the more structurally flexible the mechanical parts will become and it is at this point where the fatigue loads become a major concern, as they are closely related to the operating life of the machine and also to the operational and maintenance costs.
The purpose of this report is to highlight the importance of the controller and the contribution to the energy capture, as well as the design of a suitable operating strategy that maximized the reduction of loads while ensuring an efficient performance.
2.1 Baseline and procedure
The main objective of the control design of any wind turbine is to obtain a good trade-off between energy and loads. In variable speed pitch regulated turbines it is controlled both pitch and torque. The former is controlled to limit the aerodynamic power in above-rated power (hence, the loads), while the latter is primarily used to control the transmission torque in above rated wind speeds and to maximize energy capture below the rated power region. The operating strategy must be carefully design in order to achieve maximum power capture while limiting the aerodynamic loads in the mechanical parts of the wind turbine, as they are critical aspects of the lifetime of the machine. Therefore, the design of the operating strategy must include load reduction as an explicit objective. In this report, the design of the operating strategy has been carried out with a special focus on the control of the tower and drive train resonances, as well as the mitigation of the blade loads.
In order to design the operating strategy, it has been provided a model of a 1.5 MW variable speed, pitch regulated turbine. In the model, it was obtained the mechanical characteristics of the machine (Blade length, Gearbox ratio and so on), along with the power coefficient values for below rated operation, where the pitch of the blades was -2 degrees and is fixed for below rated operation. With the above data, it was possible to set the Cp-λ curve of the machine. This type of curves are used in wind turbine design to obtain rotor power for any combination of rotor and wind speed. By building this curve it is possible to obtain the maximum power capture. This is given by the power coefficient Cp, that it is a relationship between the power in the wind stream and the power generated by the turbine [2]. The desired operating strategy must try to achieve the maximum power capture, and hence the maximum value of Cp, and such operating point determines the optimum tip speed ratio (λ), which is the ratio between the rotor speed and the wind speed.
Once the optimum point of power extraction is set, it is possible to build the model of the machine. For this machine, the generator will operate in a range between 1 rad/s and 170 rad/s. Therefore, having the gearbox ratio, it is possible to obtain the rotor speed given the following equation:
By obtaining the range of rotor speeds of the machine, it can now be calculated the necessary wind speed for each rotor speed with the following equation:
Where λ represents the optimum tip speed ratio of the machine, which corresponds to a value of 8.4 in this design (for a Cpmax of 0.47). This range of wind speeds is used to obtain the aerodynamic torque, which is a function of the rotor speed and wind speed (when the pitch angle is fixed). Therefore, it is possible to derive the aero torque by the following equation:
Where the values of  and
and  correspond to the optimum operating point. That is, for a given wind speed and rotor speed, the objective is to produce a torque such that the power extraction from the wind is maximum. Thus, the above equation will provide the torque values for the maximum energy tracking region.
On the other hand, it is necessary to obtain the generator torque, as this will be used in order to determine the end of the first and second constant speed (To and T1). As it can be seen in the equation below, the damping losses have been considered. For this design, a damping of 5 has been assumed. The generator toque can be obtained by the following equation.
Now it is possible to obtain the power generated in the machine by having an efficiency of 95% in this machine:

And the torque at rated power of the machine is given by:
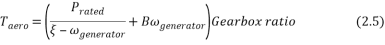
The point where the rated power curve crosses with the second constant speed line, will determine the torque which will be generating at above rated operation.
Finally, it has been calculated the values for the constant speed curves of the operating strategy. It has been applied equation 2.3, setting the wind speed constant (from 4 m/s to 12m/s) and calculated the torque for the different values of Cp and λ. The resulting operating strategy will be such that will cross every constant wind speed by the point at which is the optimum power extraction point (Cpmax).
2.2 Operating strategy process
Several factors must be considered in an operating strategy design. Having obtained the values in the previous section, it is possible to plot the maximum power extraction curve. The design must have special focus on the natural frequencies of the tower and blades. For this design, it has been provided the natural frequencies of both components. For the tower, the side-side and fore-aft frequencies. For the blades, the edge and flap frequencies were provided. Based on this, it must be analysed and compare those frequencies with the rotor speed (P), the 3P and the 6P component. It is desirable to design an operating strategy that avoids operating at multiples of the structural frequencies, as they are critical points of operation where the mechanical loads increase and the lifetime of the turbine can be reduced due to fatigue loads.
Besides, the strategy must ensure a smooth switching at the first and second constant speeds with the operating curve. This has been achieved by setting both constant speed lines with a minimum length, in such way that the controller of the turbine is switching the to different operation modes excessively, as this could reduce the efficiency of the machine.
Another important aspect to look at when designing the operating strategy, is to ensure that the wind turbine operation is not close to the stall front. The stall front curve is the curve that connects the maximum point of the constant wind speed curves. It determines the beginning of the stall region where the blades will be exposed to high loads and the power extraction will not operate efficiently.
Based on the above, the design of the operating strategy was carried out. The first constant wind speed was set at 1.2 rad/s, avoiding a 6P frequency in the blades (flap natural frequency) that would appear at approximately 1 rad/s. As the design of the operating strategy must be a trade-off between energy capture and reduction of loads, it was decided the above as the best option for this machine.
|
Rotor speed (rad/s) |
Generator torque (Nm) |
Aerodynamic Torque (Nm) |
|
|
Fist constant speed region (end) – T0 |
1.2 |
1432.923 |
163076 |
|
Second constant speed region (beginning) – T1 |
2.02 |
4640.24 |
462004 |
|
Rated torque |
2.02 |
10137 |
853106 |
Table 2.0 generator torque at constant speed switching point
The beginning of the second constant speed region is determined by the maximum generator speed which has been set at 170 rad/s (2.02 rad/s at the rotor side). It can be seen in Figure 2.0 the operating strategy curve of the machine, where it can be appraised that the operating strategy has avoided the 6P natural frequency stated above. The stall region is far enough from the operating region of the machine, ensuring a good performance and better efficiency.
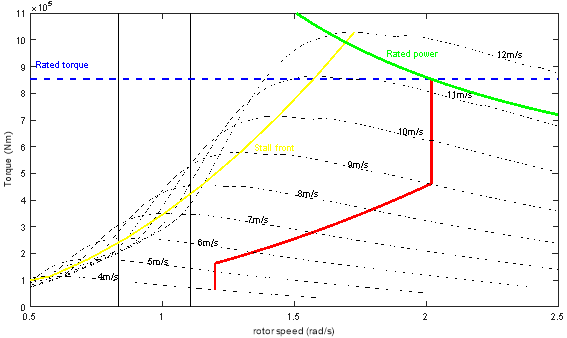
Figure 2.0 Aerodynamic torque-rotor speed diagram. Operating strategy curve of the wind turbine
2.3 Discussion of results
In general terms, the design of the machine has been successfully carried out, as it can be seen in Figure 2.0, covering the following critical aspects of any operating strategy of a wind turbine:
- After carefully analysed the natural frequencies and compared with the 3P and 6P resonance frequencies, it has been set the cut-in speed of the machine at 1.2 rad/s. Also, this strategy will ensure that the damping losses in the machine do not have excessive effect on the power generated, as at very low rotor speeds the losses can overcome the power generated.
- The operating strategy ensures that the turbine will operate between the desired wind speed range. In this report, it has been set the wind speed range between 4m/s and 25m/s.
- It has been secured a smooth switching transient between the two constant speed regions and the maximum power tracking curve by establishing a reasonable size of the constant speed regions.
It could be arguable whether this operating strategy is the most efficient or there are better options that would adapt to this wind turbine. The truth is that there are multiple options and different strategy plans depending on the preferences of the design. In this report, the aim has been to find a trade-off between load reduction and efficient power capture.
3.1 Baseline and procedure
In order to achieve an efficient operation of the wind turbine, the control must play an important role in the operating strategy. An appropriate wind controller design will allow for a better wind energy capture as well as the mitigation of fatigue loads, as they considerably reduce the lifetime of the machine. Hence, the control task of a wind turbine is to maintain the appropriate operational state as the wind speed condition change, as well as enhancing its dynamic properties. In this report, the main goal is to design the operational controller, which is divided in two different regions, below rated and above rated power.
At below rate conditions, the aim is to extract as much power from the wind as possible. This will be achieved by varying the reaction torque by measure the rotor speed or the output power. The second task of the controller is to ensure a smooth transition between the 1st constant speed region and the maximum power tracking curve.
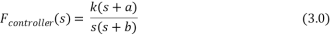
At above rated operation, the performance of the turbine will be carried out by pitching the blades. By doing so, it will allow the turbine to maintain the generation at the rated power value, take action to alleviate the increased loads at different parts of the wind turbine and to keep the desired stability margins of operation. For the above rated controller, it will be used a PI pitch controller along with an extra pole and zero and the set gain of the transfer function, resulting the transfer function as following:
The nonlinearity nature of the wind turbine operation leads to a nonlinear control design. The gain scheduling is the most used control technique to accommodate the nonlinearities [3]. The performance of this technique is to continuously change the structure of the controller according to the local set points, such as aerodynamic torque, rotor speed and pitch angle. For instance, as the torque sensitivity varies nearly linear with pitch angle, it can be compensated by varying the overall gain of the controller linearly with pitch angle. As the design of the above rated controller is normally more tedious, it will be first designed the above rated controller and then, by varying the gain, redesign the below rated controller.
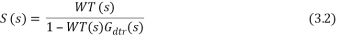
Besides, when designing the controller of variable speed pitch regulated wind turbine, it must be paid special attention to the damage caused by the vibrations on the drive train, as it produces serious risks of failure. It has been noted that for the case of the wind turbine in this that the first drive train mode need to be actively damped, in order to alleviate the large torque transients at 13 rad/s. To obtain the transfer function of the drive train filter, it will be the general form of a band pass filter:
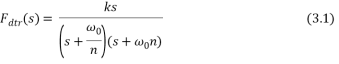
The block diagram with the filter integrated can be seen in Figure 3.0. The design of the filter will be designed such that the filter feeds back only the oscillations at the resonant frequency.
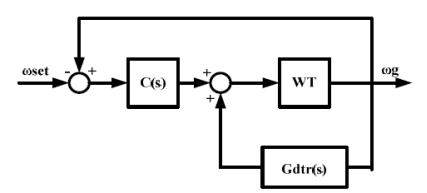
Figure 3.0 Plant with the drive train filter implemented
As the drive train filter is located at the feedback loop, the equivalent transfer function of the plant and the filter will be given by the following equation:
3.2 Drive-Train Filter and Controller Design
Drive Train Filter Design
In order to damp to suppress the peak at the first drive train mode, it has been designed the transfer function of the filter. To do so, three parameters have been set in the transfer function. The gain (k), the frequency at which it is aimed to amplify in the feedback loop ( ) and a scaling factor (n), which is used to set the frequency of the poles in the transfer function. After a trial and error procedure in MATLAB, the transfer function designed is the following:
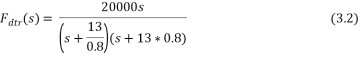
In Figure 3.1 is shown the Bode diagram of the system with and without drive train filter. It can be appraised that the peak in the drive train mode has been successfully damped, reducing the mechanical loads in the machine and hence, improving the lifetime of the turbine.

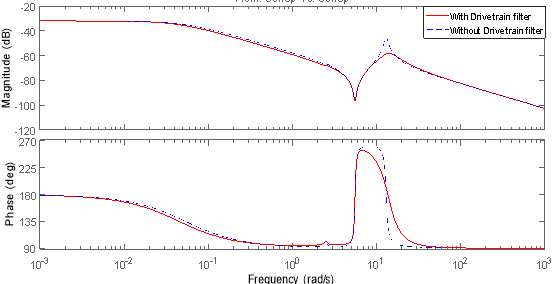
Figure 3.1 Bode plot with the effect of the drive train filter in the system
Controller Design for Above and Below Rated operation
To control rotor speed and torque it is necessary to use pitch of the blades at above rated wind speeds. It has been designed a complete controller for the turbine for smooth switching between different operating modes. Apart from the pitch-PI controller, the gain scheduling technique has been applied to the design for the non-linear design section. The controller must assure a gain and phase margins above certain levels (4 dB and 30 degrees respectively) when checking the stability using the open loop functions, providing stability for the closed loop system. The aim is to provide good disturbance rejection at low frequencies, the required bandwidth at 1 rad/s, and good high frequency roll-off. With these main objectives, the transfer function designed for the given wind turbine is the following:

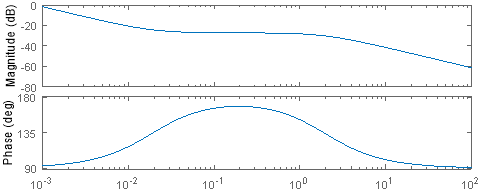
It is shown in Figure 3.2 the Bode diagram of the controller, where it can be appraised the effects that the poles, zero and gain have on the systems.
- The proportional gain of the transfer function sets the initial gain value (20 log10 (|k|) and remains constant with the frequency. The proportional gain does not contribute to the phase of the transfer function.
 Â Â
  
Figure 3.2 Bode diagram Above Rated Controller
- The pure integrator
 , produces constant gain contribution of -20 dB/dec from an infinite frequency. It also produces a constant phase of -90 degrees.
 - The pole in the transfer function contributes to the gain with a negative 20dB/dec slope at its frequency of operation (1.95 rad/s). With respect to the phase, it contributes with a -45 deg/dec between a decade after and a decade before its frequency. That is, for a frequency of 1.95 rad/s, it starts to contribute at 0.195 rad/s and will end at 19.5 rad/s.
- The zero in the transfer function contributes to the gain with a positive 20 dB/dec slope and with a positive 45 deg/dec slope for the phase. Analogous to the pole, the phase contribution starts and ends one decade before and after the frequency of the zero.
Knowing the above concepts and after a trial and error procedure, the gain scheduling technique was implemented and the design of the controller has been successfully completed. It can be seen in Figure 3.3 and 3.4 the differences between the effect of gain scheduling. It has been designed the controller for the plant dynamics at speeds of 12m/s,15m/s and 25m/s and applies for the same system with and without gain scheduling.
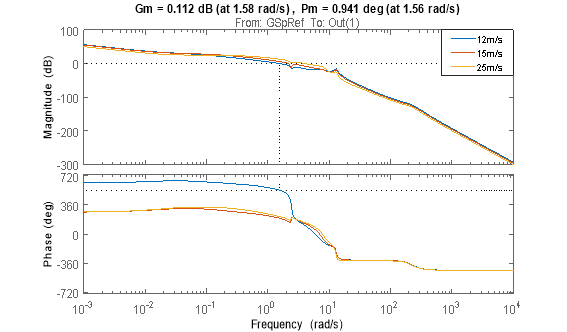
Figure 3.3 Bode diagram of the plant without gain scheduling
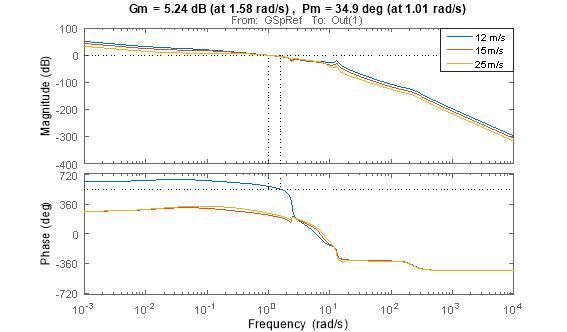
Figure 3.4 Bode diagram of the plant with gain scheduling
It can be appraised that the system with the effect of the gain scheduling becomes stable, while without the gain scheduling system the gain and phase margins do not meet the requirements stated above for a feasible strategy. The design of the controller gives a positive gain and phase margin to the system at 1rad/s, ensuring the rejection of disturbances above these frequencies [4].
Once the above rated controller is designed, it has been carried out the design for the above rated operation. It has been tested for below rated wind speeds of 4m/s and 10m/s (resulting roughly the same response) and as it can be seen in Figure 3.5, the system has been successfully integrated as the phase and gain margin meet the specified requirements. As part of the gain scheduling implementation, the transfer function of the controller for below rated condition will just adjust the gain of the transfer function. After a trial and error procedure the transfer function obtained is given by the following equation.

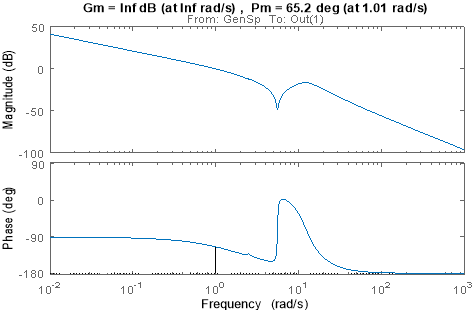
Figure 3.5 Bode diagram of below rated operation (with drive train filter)
Note that for the below rated system analysis, there must be included the drive train filter at the feedback loop.
3.3 Discussion of results
Based on the results, the design of the controller by applying gain scheduling technique has been successfully completed. As in any controller design, it must be aimed for good stability margin, both phase and margin, otherwise the system could destabilize and therefore cause high load fluctuations. Both below and above rated controller have been designed accordingly to these requirements and the phase and gain margin meet the minimum stablished (4dB for gain margin and 30 degrees for phase margin).
3.4 Effect of wind turbine size in the controller design.
An important aspect of the controller design of a wind turbine is the size of the aforementioned. The wind turbine industry is going towards an increasingly bigger size of the turbines, which brings out new challenges when it comes to the design of the controller of the machine. As the rotor is continuously interacting with a very complex wind field, the prediction of the behaviour of the machine will become more difficult with an increase in size. In other words, as the size of the machine increases, it might be extremely difficult (when not impossible) to achieve the desired margins of stability, as the structural elements will become more flexible and dynamically more active. This does not necessarily mean that the system will become unstable with a bigger turbine, but proposes that controller need to be designed and tuned more carefully as the gain and phase margins will reduce.
4.1 Baseline and procedure
As stated in section 3, the importance of the controller remains at the stability of the system. A system with low crossover frequency will present more fluctuations and a poor stability in terms of power generation, rotational speed or generator torque. The aim of this section is to give a better understanding of the design of a system with acceptable crossover frequency and also the importance of the drive train filter design, which as it was shown in the previous section, will help to damp the first drive train mode and therefore considerably reduce the mechanical loads.
The will be compared for variables of the wind turbine for both above and below rated operation. The first tasks have been the comparison between the system with good crossover frequency and the system with no drive train filter. In order to do so, it has been compared the power output of the machine, the generator speed, generator torque and the pitch angle. For simplicity on the interpretation of the results, it will be compared the simulations at 15m/s of wind speed (above rated operation), and 9m/s of wind speed (below rated operation). For each wind speed, different turbulence of the wind field has been analysed.
The second tasks have consisted on the comparison between a system with a good cross over frequency and a reduced cross over frequency. Again, to give the reader an easier understanding of the simulations, it will be compared the different systems at a wind speed of 15m/s.
4.2 Investigation of the controller performance
Comparison between the good cross over frequency and no drive train filter systems
It can be appraised in Figure 4.0, the power output of the turbine for wind speeds of 15 m/s and 9m/s. It is immediately apparent that for each speed, the higher the fluctuation, the higher the disturbance and therefore the less efficient energy production of the turbine. The mean production for 15m/s and higher disturbance accounts for 4.83MW and for 9 m/s is 2.8 MW. Compared with the wind field with small disturbance, the differences are not very noticeable, as the production accounts for approximately 4.7MW and 2.4 MW respectively.
With respect to the comparison between the different systems, the figures show negligible differences between the system response at different disturbances. This is because both systems have a crossover frequency of 1 rad/s. Besides the reason why the system with no drive train filter seems to have no effect on the system is because as stated in section 3, the aim of the filter is to damp the drive train mode at a certain frequency. As it is being plotted the response over time, the slightly differences at the frequency of damping cannot be appraised in these figures.
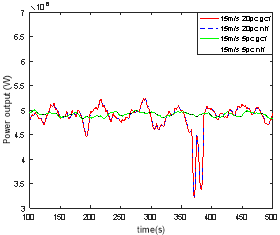
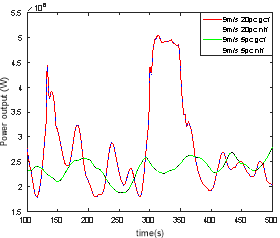
Figure 4.0 Power output of the turbine for 15m/s and 9m/s
In terms of the generator speed (Figure 4.1), the same pattern than in the power output has been acknowledge. The higher the turbulence intensity in the wind, the more difficult the control of the generator speed, and therefore the higher the fluctuations. In terms of mean values, the 15 m/s wind speed produces a mean generator speed of approximately 120 rad/s for a high turbulence intensity, and 111 rad/s at 9m/s of wind speed.
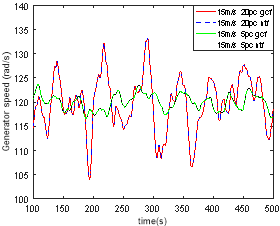
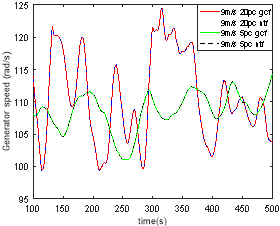
Figure 4.1 Generator speed of the turbine for 15m/s and 9m/s
Talking about the generator torque, it presents the same patterns than the previous simulation, as it can be seen in Figure 4.2, where there are no apparent differences between the two systems, and the turbulence intensity influence the variation of generator torque. The mean values for the higher turbulence intensity are 26.2KNm and 42.4KNm for 9m/s and 15m/s respectively. For the lower fluctuation of wind, the mean values of torque account for 22.7KNm and 42.7KNm.
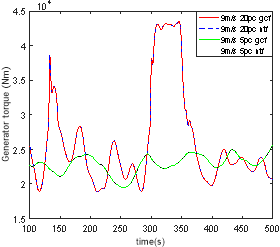
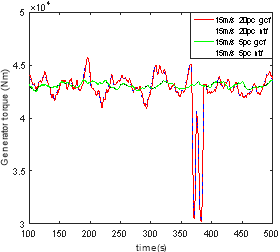
Figure 4.2 Generator torque of the turbine for 15m/s and 9m/s
As a final analysis, it has been plotted the pitch angle for the different system at different speeds. It can be appraised in Figure 4.3 that the pitching of the blades does not perform at 9m/s, except when the turbulence intensity is significantly high, in which case it might overpass the above rated wind speed and therefore the pitching start to act. By contrast, for the 15m/s simulation speed, the pitching angle varies constantly trying to absorb energy from the wind more efficiently.
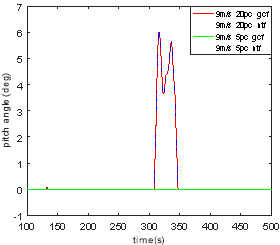
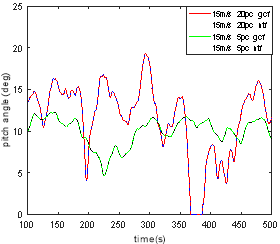
Figure 4.3 Pitch angle of the turbine for 15m/s and 9m/s
Comparison between reduced and good crossover frequency
It has been simulated the response of the two system with good and reduced crossover frequency. The good crossover system has a crossover frequency of 1 rad/s while the reduced crossover system is 0.5 rad/s. The results are shown in Figure 4.4 and 4.5, where some differences can be noticed. The reduced crossover frequency system has a more unstable generation of power for both turbulence intensity scenarios. As stated in Section 3, the system with a reduced crossover frequency will have a poorer performance under disturbances and will reject those more inefficiently than the one with a good cross over frequency.
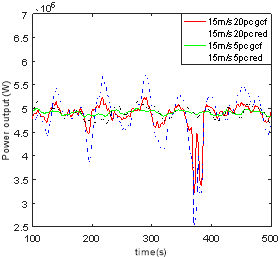
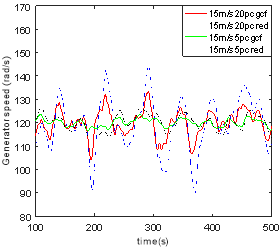
Figure 4.4 Power output and generator speed of the turbine for 15m/s and 9m/s
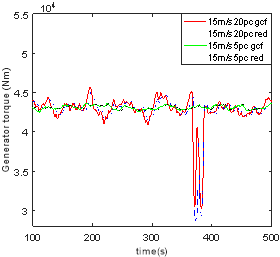
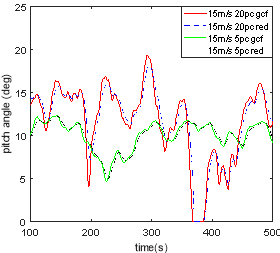
Figure 4.5 Generator torque and pitch angle of the turbine for 15m/s and 9m/s
Having designed and analysed the different aspect of a wind turbine controller, it can be concluded that the design has been carried out successfully, ensuring a stable performance of the system with an efficient mitigation of loads. It can be argued whether the design of both operating strategy and controller are the best option in terms of performance, but the main objective of this report is to give an understanding of the performance of the machine and the control system operation, as well as to understand the new challenges that the increasingly size of the wind turbines might bring to the design of the control strategy.
|
[1] |
E. A. Bossanyi, “The Design of Closed Loop Controllers for Wind Turbines,” Wind Energy, vol. 3, pp. 149-163, 2000. |
|
[2] |
T. Burton, “Cp-lamda performance,” Chichester, Willey, 2011, pp. 173-174. |
|
[3] |
A. P. Chatzopoulos, “Full Envelope Wind Turbine Controller Design for Power Regulation and Tower Load Reduction,” University of Strathclyde, Glasgow, 2014. |
|
[4] |
H. D. B. A. R. J. M. Fernando D. Bianchi, “Control of Variable-Speed Variable-pitch Wind turbines Using Gain Scheduling Techniques,” in Wind turbine control systems, London, Springer, 2007. |
Cite This Work
To export a reference to this article please select a referencing stye below:
Related Services
View all


DMCA / Removal Request
If you are the original writer of this essay and no longer wish to have your work published on UKEssays.com then please click the following link to email our support team:
Request essay removal