Big Data: Map Reduce Based Outlier Identification for Fraud
| ✅ Paper Type: Free Essay | ✅ Subject: Computer Science |
| ✅ Wordcount: 2850 words | ✅ Published: 03 Apr 2018 |
Big Data: Fast, Parallel Map Reduce based outlier identification for Fraud and Intrusion Detection
Pooja Vijay Pawar Ann Marie Joy
Abstract
One of the most challenging aspect of Big Data analytics is real time monitoring of data. Larger and larger amount of data is being collected and stored on a daily basis, thus increasing the need for quick, effective and efficient way of analysing the data in determining potential malicious data. Also network security threats are increasing at an alarming rate and are becoming increasingly sophisticated and difficult to detect. Web traffic generated by non-human activities such as botnets or worms consume network resources, delude people and affect network security. Most of the existing work in Fraud Detection/Intrusion Detection regard being an outlier as a binary property. In this paper we use a relative density based approach implemented as a MapReduce job, which gives a sense of degree of a data point being an outlier; this is more meaningful and also better immune to false positives.
Keywords
Big Data, Fraud detection, Intrusion Detection, Hadoop, Outlier, Cluster, Security, Relative Density, LOF
1. Introduction
We are currently living in a world where we are surrounded and ruled by data. Continuously, exponentially huge amounts of data is collected, stored, processed and made available in a variety of forms every day. Recently, Network Intrusion and Fraud detection has received increased attention with regard to network security, mainly due to this.
Big Data is drastically changing the way in which we detect fraud and intrusion in real time using advanced analytic solutions that are very powerful, complex and fast. In this paper, we propose a methodology to detect Fraudulent Web traffic and Intrusion in a network using MapReduce-based outlier detection. These features help in filtering out clients that generate abnormal traffic and specifically show different levels of potential anomalous traffic for each suspicious client. The detected abnormal web traffic can be visualized easily and this method can be implemented for large networks and can be scaled accordingly.
Outlier can be defined as a data which is very distinct from the other data of the same dataset, based on some distance measure. Outlier detection, being a significant data mining problem has engendered a lot of research interest in the recent past. As a result, various methods for outlier detection have been developed particularly for dealing with numerical data. However, outlier detection for categorical data still remains an unexplored field. Addressing this requirement, we propose a two-phase algorithm for detecting outliers in categorical data based on a novel definition of outliers. This algorithm initially explores a clustering of the given data which is followed by the ranking phase for determining the set of most likely outliers. The proposed methodology is expected to show better results as it can identify different types of outliers, using independent ranking scheme based on the inherent clustering structure of the given data.
Hadoop is a very popular open source Apache project, which is used for storing and processing huge volume of data on commodity hardware. Hadoop package mainly consists of MapReduce Engine and Hadoop File system. Many Frameworks have been built on top of Hadoop. Using the distributed architecture of Hadoop in this paper we discuss how we can exploit it for identifying outliers in captured network data.
2. Related Work
There has been lot of research and number of techniques which have been developed in the past two decades with respect to fraud detection and Intrusion Detection. Lot of machine learning techniques such as Neural Networks, Markov model, K Nearest Neighbour have drawn special attention. In this paper we use unsupervised Machine Learning techniques to identify fraudulent transactions using Hadoop.
Most current practices to the process of detecting intrusions exploit some form of rule-based study. Rule-based analysis depend on sets of predefined rules that are configured by an administrator and are automatically created by the system. The use of automated system techniques in intrusion detection mechanisms was a significant milestone in the development of effective and practical detection based information security systems. Rule-based systems suffer from an incompetence to detect attacks situations that may occur over an extended duration of time.
However most significant benefit of neural networks in intrusion detection is the capability of the neural network to “learn” the characteristics of abnormal attacks and recognize instances that are unlike any which have been detected before by the network.
Majority of studies that proposed Hidden Markov Model to implement IDS are related to host-based systems, i.e., IDS that analyses the actions performed on a single host to detect attempts of intrusion.
3. Outlier Detection Algorithms
Outliers can be detected using various different techniques. Some of the techniques are discussed below
3.1 Distance-based and Clustering Approaches
Distance-based methods do not make conventions for the data since they basically compute the distance between each point. For example, Knorr et al. Proposed a k-NN technique where, if m of the k nearest neighbours of a point are within a specific distance d, then the point can be classified as normal. Knorr et al. points as an outlier if at least p% of the points in the dataset lie more than distance 10 d from it. These methods show high computational complexity (e.g. nearest neighbour based methods have quadratic complexity with respect to the number of data points) which renders them impractical for really large datasets. Several approaches may be engaged to make the k-NN queries faster (to achieve linear or logarithmic time), such as an indexing structure (e.g. KD-tree, or X-tree); however these structures have been shown to break down as the dimensionality grows.
Clustering can be defined as the task of grouping a set of objects in such a way that objects in the same group share some feature similarity among each other than to those in other groups. Clustering is one of the very popular techniques currently being used in outlier detection.
Any object that has weak membership to the cluster it belongs to is a potential outlier. If there are any small clusters from other clusters, then the smaller cluster could potentially be an outlier. For instance there could be many different kinds of fraudulent transactions which might have high similarity among themselves and form a cluster.
There are additional problems with clustering. Clustering algorithms are optimized to find clusters rather than outliers. Hence, sometimes it may be hard to tell whether a cluster belongs to fraudulent transactions or some new emergent buying behaviour of a legitimate user. Hence before making a final call we must perform additional analysis.
3.2 Statistical distribution
Statistical outlier detection was one of the most basic approaches dating back to the 19th century. Multivariate statistical methods have been proposed, together with use of robust outlier’s estimates of the multidimensional distribution parameters, e.g. minimum covariance 9 determinant (MCD) and minimum volume ellipsoid (MVE). One critical problem of statistical-based methods is the suitable model for each dataset and application. Also, as data rises in dimensionality, it becomes ever more perplexing to estimate the multidimensional distribution. As the data increases in dimensionality, data ranges through a larger volume and becomes sparse. In addition to the reduction this has on performance, it also spreads the convex hull, thus altering the data distribution. This can be improved by pre selecting the most noteworthy features to work, projecting to a lower-dimensional subspace, or applying Principal Component Analysis (PCA). Another methodology to deal with higher dimensionalities is to organize data points in convex hull layers according to their peeling depth, based on the idea that outliers are data objects with a shallow depth value.
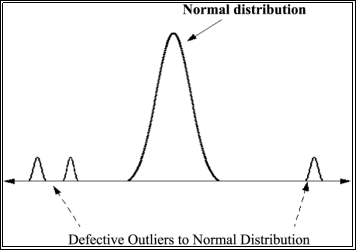
Fig 1
In this approach one main assumption is that data objects follows a certain distribution (E.g. Gaussian) and normal data objects occur in a high probability region of this model.
Fig.1 shows an example where there is high concentration of data points lying in the normal region which associates to normal data points; the mini distributions on both sides of the normal distributions are possible outliers. As shown in Fig.1 outliers will deviate strongly from this distribution.
There are lot of issues with this technique too, main being the curse of dimensionality, other being lack of robustness. This is because Mean and standard deviation are very sensitive to outliers.
3.3 Density Based approach
In this technique we compare the density around a data point with the density around its local neighbours. The computed density is called an outlier score. The main assumption here is that the density around a normal data point is almost similar to the density around its local neighbours. Here Density/Outlier score means that some clusters are densely packed and some others are not. Mathematically, it is defined as the inverse of the average distance to the k nearest neighbours.
Lower density of a data point signifies that the probability of it being an outlier is very high. There have been many variants of Density based approaches suggested in the past few decades, majority of which deal with decreasing the computational time 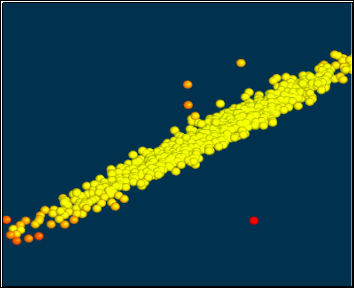 complexity.
In Fig.2 the points which are densely packed, appearing yellow indicate normal data points, the ones which are away from the cluster are outliers, possible candidates for malicious data. In this paper, we use this technique to determine possible candidates for outliers.
4. Experiment
For our experiment we used KDD Cup 1999: Computer network intrusion detection dataset for testing and evaluating our approach. We used Relative Density [3] based approach for our system. Which involved 4 Map Reduce Tasks. The Algorithms works as follows:
Computing K-NN [3]
We begin with the notion of K-Nearest Neighbour of object p.
Definition: K-Nearest Neighbour of object p
For any positive integer k, the k-distance of object p, denoted as k-distance (p), is defined as the distance d(p,o) between p and an object o ∈ D such that:
(i) For at least k objects o’∈D{p} it holds that d(p,o’) ≤ d(p,o), and (ii) For at most k-1 objects o’∈D{p} it holds that d(p,o’) < d(p,o).
Given the k-distance of p, the k-distance neighbourhood of p contains every object whose distance from p is not greater than the k-distance, i.e.
Nk-distance (p) (p) = { q ∈ D{p} | d(p, q) ≤ k- distance(p) }
These objects q are called the k-nearest neighbours of p.
We use 2 MapReduce tasks, one to compute the pairwise distance between data points as explained above and other to compute the density of the data point. The density of a data point is simply the inverse of the average distance to the k nearest neighbours.
Finding all the neighbourhood group the data points are associated with and also give them unique id
We define one more term reachability distance of an object p w.r.t the data point o to determine the neighbourhood.
Definition: Reachability distance of an object p w.r.t. object or
Let k be a natural number. The reachability distance of object p with respect to object o is defined as
reach-distk(p, o) = max { k-distance(o), d(p, o) }.
The higher the value of k, the more similar the reachability distances for objects within the same neighbourhood.
We use the same MapReduce class as before with slightly different configuration to identify the neighbourhood. Once neighbourhood are identified they are given a unique ID.
Using previous results, create a mapping between data point and its density.
In a typical density-based clustering algorithm, there are two parameters that define the notion of density:
(i) a parameter MinPts specifying a minimum number of objects;
(ii) a parameter specifying a volume.
These two parameters determine a density threshold for the clustering algorithms to operate. That is, objects or regions are connected if their neighbourhood densities exceed the given density threshold. To detect density based outliers, however, it is necessary to compare the densities of different sets of objects, which means that we have to determine the density of sets of objects dynamically. Therefore, we keep MinPts as the only parameter and use the values reach-distMinPts(p, o), for o ∈ NMinPts(p), as a measure of the volume to determine the density in the neighbourhood of an object p.
Definition: Density of an object p
lrdMinPts(p) = 1/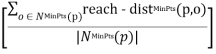
Intuitively, the local reachability density of an object p is the inverse of the average reachability distance based on the MinPts- nearest neighbours of p. Note that the local density can be ∞ if all the reachability distances in the summation are 0. This may occur for an object p if there are at least MinPts objects, different from p, but sharing the same spatial coordinates, i.e. if there are at least MinPts duplicates of p in the dataset. For simplicity, we will not handle this case explicitly but simply assume that there are no duplicates.
Hence in our MapReduce implementation, first we sort the data points based on density data and the neighbourhood, such that in the input for the reducer, we get first value as density, and the subsequent values are the neighbourhood ids.
Determining the Relative Density or LOF (Local Outlier Factor)
Results from the previous step is then used in another MapReduce task to compute the relative density or also called as Local Outlier Factor (LOF).
Definition:
LOFMinPts(p) = 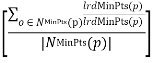
The outlier factor of object p captures the degree to which we call p an outlier. It is the average of the ratio of the local reachability density of p and those of p’s MinPts-nearest neighbours. It is easy to see that the lower p’s local reachability density is, and the higher the local reachability densities of p’s MinPts-nearest neighbours are, the higher is the LOF value of p. In the following section, the formal properties of LOF are made precise. To simplify notation, we drop the subscript MinPts from reach-dist, lrd and LOF, if no confusion arises.
Finally, Data Points which have low relative Density or LOF are determined as possible candidates for outliers.
5. Conclusion
Existing Intrusion detection system are in nascent stage in handling extremely large traffic and the data transfers in large Networks. MapReduce Framework can handle large amount of data quickly and efficiently. Thus our proposed methodology for Outlier detection using Relative Density based approach not only can handle large amount of data but also scales easily. In near future full of MapReduce based IDS needs to developed and evaluated. We also plan to explore multiple classifier system compared to single classifier to get improved results.
6. Acknowledgement
This work is supported by CSE Department, PES Institute of Technology.
7. References
[1] Barnett, V., Lewis, T. (1995). Outliers in Statistical Data. Wiley, 3rd Edition. [2] Davide Ariu, Giorgio Giacinto, and Roberto Perdisci, Sensing attacks in Computers Networks with Hidden Markov Models. [3] Ng, Jorg Sander, Hans-Peter Kriegel, Raymond T, Markus M. Breunig. LOF: Identifying Density-Based Local Outliers [4] Manh Cong Tran, Lee Hee Jeong, Yasuhiro Nakamura. Abnormal Web Traffic Detection Using Connection Graph. [5] Suri, N.N.R.R. Centre for AI & Robot., Bangalore, India Murty, M.N. ; Athithan, G..An algorithm for mining outliers in categorical data through ranking. [6] Kuo Zhao, Liang Hu. Intrusion Detection and Prevention in high speed network.[7] Qing He Yunlong Ma, Qun Wang, Fuzhen Zhuang, Zhongzhi Shi.Parallel Outlier Detection Using KD-Tree Based on MapReduce [8] Koufakou, A. Sch, FL Secretan, J., Reeder, J., Cardona, K., Georgiopoulos, M.Fast parallel outlier detection for categorical datasets using MapReduce. [9] Ganesh Ananthanarayanan, Srikanth Kandula, Albert Greenberg, Ion Stoica, Yi Lu, Bikas Saha, Edward Harris . Reining in the Outliers in Map-Reduce Clusters using Mantri. [10] H. Günes Kayacık, A. Nur Zincir-Heywood, Malcolm I. Heywood. Selecting Features for Intrusion Detection:A Feature Relevance Analysis on KDD 99 Intrusion Detection Datasets. [12] E. Eskin, A. Arnold, M. Prerau, L. Portnoy, S. Stolfo, “A geometric framework for unsupervised anomaly detection: Detecting intrusions in unlabeled data,” in Applications of Data Mining in Computer Security, Chapter 4, D. Barbara and S. Jajodia (editors), Kluwer. [13] Q. He, F.Z. Zhuang, J.C. Li, Z.Z. Shi. Parallel implementation of classification algorithms based on mapreduce. International Conference on Rough Set and Knowledge Technology. [15]Koufakou, A., Ortiz, E., Georgiopoulos, M., Anagnostopoulos, G., Reynolds, K., “A Scalable and Efficient Outlier Detection Strategy for Categorical Data”, Int’l Conference on Tools with Artificial Intelligence ICTAI, October, 2007. [16] Big Data Analytics for Security Intelligence, CLOUD SECURITY ALLIANCE – September 2013. [17] DuMouchel W., Schonlau M.: “A Fast Computer Intrusion Detection Algorithm based on Hypothesis Testing of Command Transition Probabilities”, Proc. 4th Int. Conf. on Knowledge Discovery and Data Mining, New York, NY, AAAI Press, 1998, pp. 189-193. [18] Ramaswamy S., Rastogi R., Kyuseok S.: “Efficient Algorithms for Mining Outliers from Large Data Sets”, Proc. ACM SIDMOD Int. Conf. on Management of Data, 2000. [19] Fawcett T., Provost F.: “Adaptive Fraud Detection”, Data Mining and Knowledge Discovery Journal, Kluwer Academic Publishers, Vol. 1, No. 3, 1997, pp. 291-316. [20] Holtz, Marcelo D., Bernardo M. David, and Rafael Timóteo de Sousa Júnior. “Building Scalable Distributed Intrusion Detection Systems Based on the MapReduce Framework.” Telecomunicacoes (Santa Rita do Sapucai) 13 (2011): 22-31. [21] DuMouchel W., Schonlau M.: “A Fast Computer Intrusion Detection Algorithm based on Hypothesis Testing of Command Transition Probabilities”, Proc. 4th Int. Conf. on Knowledge Discovery and Data Mining, New York, NY, AAAI Press, 1998, pp. 189-193.
1
Cite This Work
To export a reference to this article please select a referencing stye below:
Related Services
View all


DMCA / Removal Request
If you are the original writer of this essay and no longer wish to have your work published on UKEssays.com then please click the following link to email our support team:
Request essay removal